5주차 - EKS Autoscaling - #1
CloudNet@ 가시다님이 진행하는 AWS EKS Hands-on Study 내용 참고.
이론 정리
- 리소스 부족 대응 기술

Kubernetes autoscaling overview - CON324_Optimizing-Amazon-EKS-for-performance-and-cost-on-AWS.pdf 발췌


☞ [영상] EKS 오토스케일링* ‘24 - Link
- resource.requestes(CPU,Memory) 설정과 미설정 시 동작

- 수평 확장 Horizontal Scaling
- 운영 환경에 더 많은 워크로드(VM, Task, Pod)를 추가하는 방식
- 트래픽을 여러 워크로드에 분산시키는 방법
- 확장성이 높고 유연한 방법
- 비용 효율적
- Stateless 워크로드에 적합 (데이터 일관성 유지 필요)
- 수직 확장 Vertical Scaling
- 운영 환경의 기존 워크로드의 성능(CPU, Memory)을 향상하는 방법
- 하드웨어는 확장에 한계가 존재함
- 확장 과정에서의 장애 위험이 존재함
- 수평적 확장과 비교하면 유연성이 부족함
- AWS Auto Scaling 정책
- Simple/Step scaling : Manual Reactive, Dynamic scaling
- 고객이 정의한 단계에 따라 메트릭을 모니터링하고 인스턴스를 추가 또는 제거합니다.
- Target tracking : Automated Reactive, Dynamic scaling
- 고객이 정의한 목표 메트릭을 유지하기 위해 자동으로 인스턴스를 추가 또는 제거합니다.
- Scheduled scaling : Manual Proactive
- 고객이 정의한 일정에 따라 인스턴스를 시작하거나 종료합니다.
- Predictive scaling : Automated Proactive
- 과거 트렌드를 기반으로 용량을 선제적으로 시작합니다.
- Simple/Step scaling : Manual Reactive, Dynamic scaling
- K8S Auto Scaling 정책
- 확장 방법 : 컨테이너(파드) vs 노드(서버)
- 컨테이너 수평적 확장
- 컨테이너 수직적 확장
- 노드 수평적 확장
- 노드 수직적 확장
- 확장 기준
- 컨테이너 메트릭 기반
- 애플리케이션 메트릭 기반
- 이벤트(일정, 대기열 등) 기반
- 확장 정책
- 단순 확장 정책
- 단계 확장 정책
- 목표 추적 확장 정책
- 확장 방법 : 컨테이너(파드) vs 노드(서버)
- EKS Auto Scaling - Link
- HPA : 서비스를 처리할 파드 자원이 부족한 경우 신규 파드 Provisioning → 파드 Scale Out
- VPA : 서비스를 처리할 파드 자원이 부족한 경우 파드 교체(자동 or 수동) → 파드 Scale Up
- CAS : 파드를 배포할 노드가 부족한 경우 신규 노드 Provisioning → 노드 Scale Out
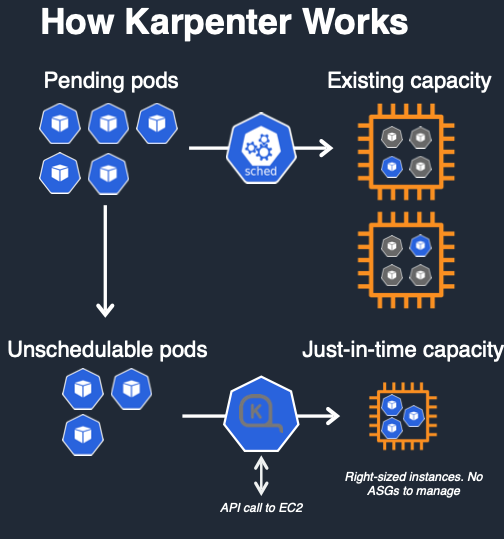
- Karpenter : Unscheduled 파드가 있는 경우 새로운 노드 및 파드 Provisioning → 노드 Scale Up/Out
- AWS Auto Scaling 한계 → 관리 복잡성 증가, 최적화 설정 어려움, 비용 관리 어려움

-
- 오토스케일링 전략은 EC2의 오토스케일링 그룹 사용을 중심으로 동작합니다
- 노드 그룹에서 인스턴스 타입이 동일하다고 가정합니다.
- 혼합 인스턴스 타입은 가능한 CPU와 메모리가 균등하게 되어야 합니다.
- 다양한 인스턴스 타입을 지원하기 위해서는 여러 노드 그룹이 필요합니다.
- 모범사례는 AZ당 노드 그룹을 가지는 것입니다.
- 카펜터 : 유연한 노드 프로비저닝, 빠른 스케일링 및 비용 최적화, 똑똑한 통합 관리 및 간소화된 설정, 향상된 리소스 활용 및 확장성


- EC2와 긴밀히 통합 : EC2 Fleet API, ASGs 가 없음
- 쿠버네티스 네이티브 : Watch API, Labels, Finalizers
- 자동화된 인스턴스 선택 : 워크로드 요구사항을 인스턴스 타입과 일치
- 기본 동작 흐름 : 카펜터가 ‘파드 unschedulable’ 감지 후 Pod 스펙 평가 후 ‘EC2 Fleet’를 통해 노드 프로비저닝
- Over Provisioning : 스파이크 트래픽 대비하기 - 여유 노드를 항상 유지하기, 더미파드 사용(낮은 우선순위 적용)
- Custom Metric 활용하기 : Resource Metric API, Custom Metric API, External Metric API
- Resource Metric API : Node 또는 Pod의 CPU, 메모리 사용량 등의 metric 기반으로한 파드 스케일링, metrics.k8s.io
- Custom Metric API : 사용자가 정의한 클러스터 내부의 metric을 기반으로 파드 스케일링, custom.metrics.k8s.io
- External Metric API : 클러스터 외부에서 수집된 metric 을 기반으로 파드 스케일링, external.metrics.k8s.io

- KEDA 활용하기 : 다양한 Event로 Scaling 수행
- 이벤트 기반 파드 오토스케일링 (HPA 이용)
- 트리거 : cron, ..
- ScaledObject 오브젝트에 명세 정의
- 카펜터와 통합되어 클러스터 수준 오토스케일링 지원 : 예) Cron으로 특정 시간에 노드 증설
☞ Auto Scaling 그림 소개 1 : 출처 - (🧝🏻♂️)김태민 기술 블로그 - 링크
- K8S 오토스케일링 3가지 : HPA(Scale In/Out), VPA(Scale Up/Down), CA(노드 레벨)

아래 그림 출처 : https://www.oreilly.com/library/view/production-kubernetes/9781492092292/ch01.html
- Workload Autoscaling - Horizontal Pod Autoscaler

- Workload Autoscaling - Vertical Pod Autoscaler

Cluster Autoscaling

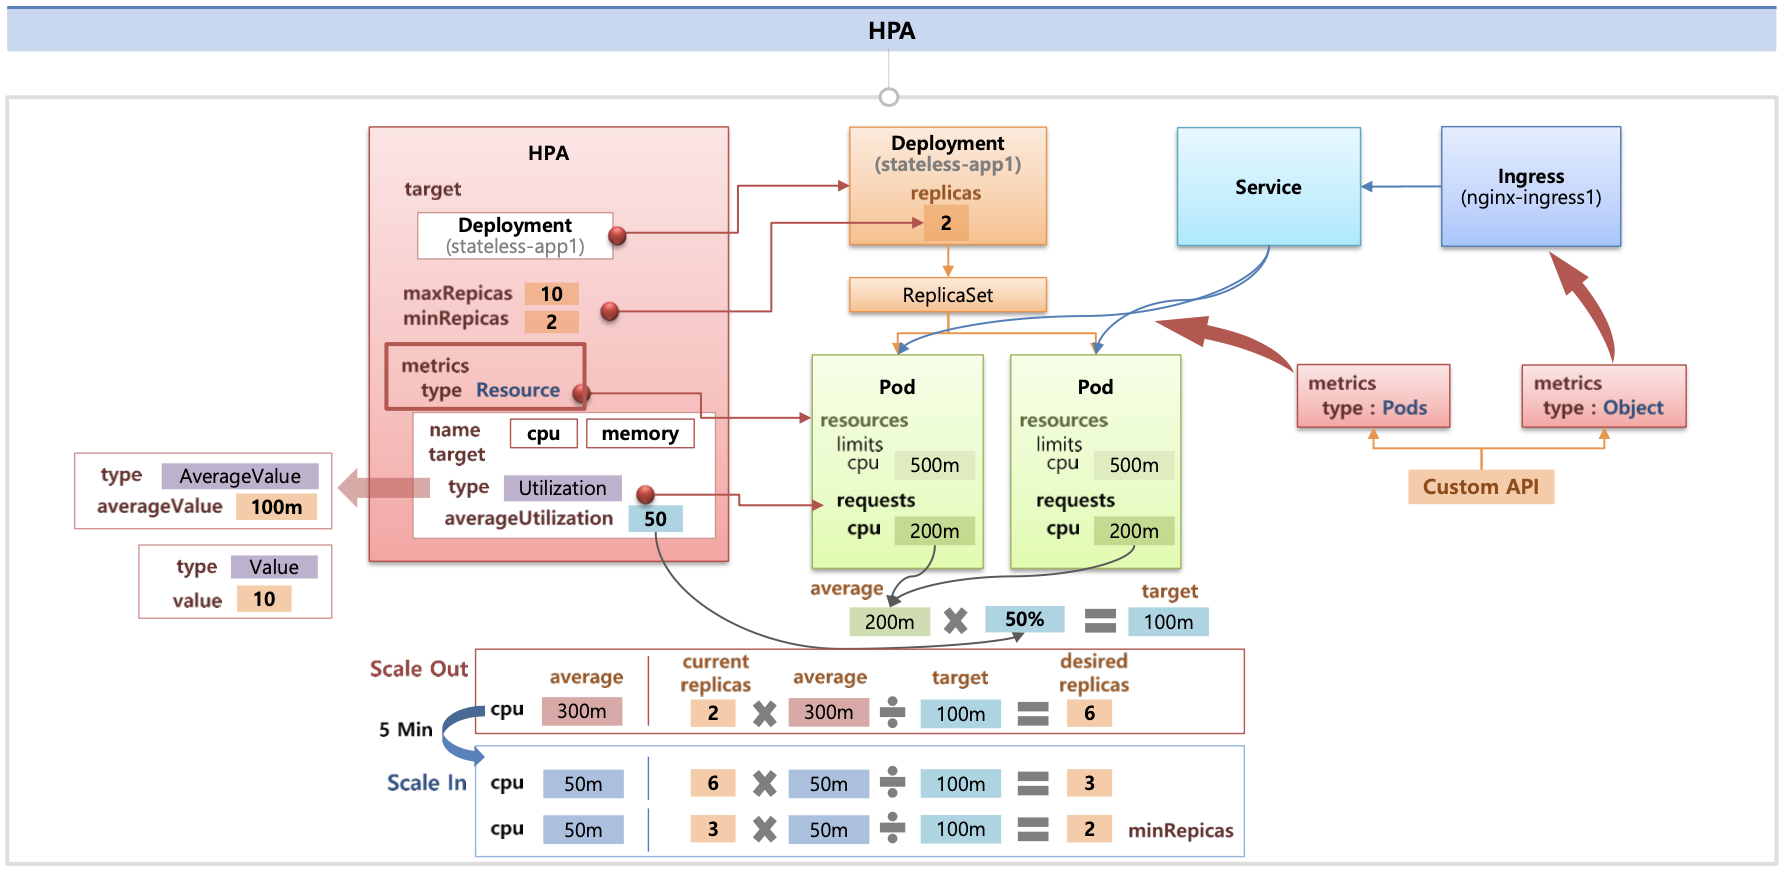
- HPA 아키텍처 : cAdvisor 이 컨테이너의 메모리/CPU 수집 → metrics-server 는 kubelet 를 통해서 수집 후 apiserver 에 등록 → HPA는 apiserver(Resource API)를 통해서 15초 마다 메모리/CPU 수집하여 정책에 따라 동작

- metrics.type(Resource, Pods, Object), target.type(Utilization, AverageValue, Value)
☞ Auto Scaling 그림 소개 2 : k8s 관련 책 발췌
- HPA


- 파드(디플로이먼트) 롤링 업데이트 전략

- KEDA

- VPA

- CAS

☞ Resource Management for Pods and Containers* - Docs , PodQoS
0. 실습 환경 배포 & 소개
☞ Amazon EKS (myeks) 윈클릭 배포 & 기본 설정
- Amazon EKS (myeks) 윈클릭 배포
# YAML 파일 다운로드
curl -O https://s3.ap-northeast-2.amazonaws.com/cloudformation.cloudneta.net/K8S/myeks-5week.yaml

# 변수 지정
CLUSTER_NAME=myeks
SSHKEYNAME=<SSH 키 페이 이름>
MYACCESSKEY=<IAM Uesr 액세스 키>
MYSECRETKEY=<IAM Uesr 시크릿 키>

# CloudFormation 스택 배포
aws cloudformation deploy --template-file myeks-5week.yaml --stack-name $CLUSTER_NAME --parameter-overrides KeyName=$SSHKEYNAME SgIngressSshCidr=$(curl -s ipinfo.io/ip)/32  MyIamUserAccessKeyID=$MYACCESSKEY MyIamUserSecretAccessKey=$MYSECRETKEY ClusterBaseName=$CLUSTER_NAME --region ap-northeast-2

# CloudFormation 스택 배포 완료 후 작업용 EC2 IP 출력
aws cloudformation describe-stacks --stack-name myeks --query 'Stacks[*].Outputs[0].OutputValue' --output text
- (옵션) 배포 과정 살펴보기
# 운영서버 EC2 SSH 접속
ssh -i <SSH 키 파일 위치> ec2-user@$(aws cloudformation describe-stacks --stack-name myeks --query 'Stacks[*].Outputs[0].OutputValue' --output text)
ssh -i ~/.ssh/kp-gasida.pem ec2-user@$(aws cloudformation describe-stacks --stack-name myeks --query 'Stacks[*].Outputs[0].OutputValue' --output text)
-------------------------------------------------
#
whoami
pwd

# cloud-init 실행 과정 로그 확인
tail -f /var/log/cloud-init-output.log

# eks 설정 파일 확인
cat myeks.yaml

# cloud-init 정상 완료 후 eksctl 실행 과정 로그 확인
tail -f /root/create-eks.log

#
exit
-------------------------------------------------
- 자신의 PC에서 AWS EKS 설치 확인 ← 스택 생성 시작 후 20분 후 접속 할 것
# 변수 지정
CLUSTER_NAME=myeks
SSHKEYNAME=kp-gasida

#
eksctl get cluster

# kubeconfig 생성
aws sts get-caller-identity --query Arn
aws eks update-kubeconfig --name myeks --user-alias <위 출력된 자격증명 사용자>
aws eks update-kubeconfig --name myeks --user-alias admin

#
kubectl ns default
kubectl get node --label-columns=node.kubernetes.io/instance-type,eks.amazonaws.com/capacityType,topology.kubernetes.io/zone
kubectl get pod -A
kubectl get pdb -n kube-system
- 노드 IP 정보 확인 및 SSH 접속
# EC2 공인 IP 변수 지정
export N1=$(aws ec2 describe-instances --filters "Name=tag:Name,Values=myeks-ng1-Node" "Name=availability-zone,Values=ap-northeast-2a" --query 'Reservations[*].Instances[*].PublicIpAddress' --output text)
export N2=$(aws ec2 describe-instances --filters "Name=tag:Name,Values=myeks-ng1-Node" "Name=availability-zone,Values=ap-northeast-2b" --query 'Reservations[*].Instances[*].PublicIpAddress' --output text)
export N3=$(aws ec2 describe-instances --filters "Name=tag:Name,Values=myeks-ng1-Node" "Name=availability-zone,Values=ap-northeast-2c" --query 'Reservations[*].Instances[*].PublicIpAddress' --output text)
echo $N1, $N2, $N3

# *remoteAccess* 포함된 보안그룹 ID
aws ec2 describe-security-groups --filters "Name=group-name,Values=*remoteAccess*" | jq
export MNSGID=$(aws ec2 describe-security-groups --filters "Name=group-name,Values=*remoteAccess*" --query 'SecurityGroups[*].GroupId' --output text)

# 해당 보안그룹 inbound 에 자신의 집 공인 IP 룰 추가
aws ec2 authorize-security-group-ingress --group-id $MNSGID --protocol '-1' --cidr $(curl -s ipinfo.io/ip)/32

# 해당 보안그룹 inbound 에 운영서버 내부 IP 룰 추가
aws ec2 authorize-security-group-ingress --group-id $MNSGID --protocol '-1' --cidr 172.20.1.100/32

# 워커 노드 SSH 접속
for i in $N1 $N2 $N3; do echo ">> node $i <<"; ssh -o StrictHostKeyChecking=no ec2-user@$i hostname; echo; done

- 운영서버 EC2 에 SSH 접속 (SSH 키 파일 사용) : AWS EKS 설치 확인 ← 스택 생성 시작 후 20분 후 접속 할 것
# default 네임스페이스 적용
kubectl ns default

# 환경변수 정보 확인
export | egrep 'ACCOUNT|AWS_|CLUSTER|KUBERNETES|VPC|Subnet'
export | egrep 'ACCOUNT|AWS_|CLUSTER|KUBERNETES|VPC|Subnet' | egrep -v 'KEY'

# krew 플러그인 확인
kubectl krew list

# 인스턴스 정보 확인
aws ec2 describe-instances --query "Reservations[*].Instances[*].{InstanceID:InstanceId, PublicIPAdd:PublicIpAddress, PrivateIPAdd:PrivateIpAddress, InstanceName:Tags[?Key=='Name']|[0].Value, Status:State.Name}" --filters Name=instance-state-name,Values=running --output table

# 노드 IP 확인 및 PrivateIP 변수 지정
aws ec2 describe-instances --query "Reservations[*].Instances[*].{PublicIPAdd:PublicIpAddress,PrivateIPAdd:PrivateIpAddress,InstanceName:Tags[?Key=='Name']|[0].Value,Status:State.Name}" --filters Name=instance-state-name,Values=running --output table
N1=$(kubectl get node --label-columns=topology.kubernetes.io/zone --selector=topology.kubernetes.io/zone=ap-northeast-2a -o jsonpath={.items[0].status.addresses[0].address})
N2=$(kubectl get node --label-columns=topology.kubernetes.io/zone --selector=topology.kubernetes.io/zone=ap-northeast-2b -o jsonpath={.items[0].status.addresses[0].address})
N3=$(kubectl get node --label-columns=topology.kubernetes.io/zone --selector=topology.kubernetes.io/zone=ap-northeast-2c -o jsonpath={.items[0].status.addresses[0].address})
echo "export N1=$N1" >> /etc/profile
echo "export N2=$N2" >> /etc/profile
echo "export N3=$N3" >> /etc/profile
echo $N1, $N2, $N3

# 노드 IP 로 ping 테스트
for i in $N1 $N2 $N3; do echo ">> node $i <<"; ping -c 1 $i ; echo; done

- EKS 배포 후 실습 편의를 위한 설정
- Windows (WSL2 - Ubuntu) ⇒ 실습 완료 후 삭제 할 것!
# 변수 지정
export CLUSTER_NAME=myeks
export VPCID=$(aws ec2 describe-vpcs --filters "Name=tag:Name,Values=$CLUSTER_NAME-VPC" --query 'Vpcs[*].VpcId' --output text)
export PubSubnet1=$(aws ec2 describe-subnets --filters Name=tag:Name,Values="$CLUSTER_NAME-Vpc1PublicSubnet1" --query "Subnets[0].[SubnetId]" --output text)
export PubSubnet2=$(aws ec2 describe-subnets --filters Name=tag:Name,Values="$CLUSTER_NAME-Vpc1PublicSubnet2" --query "Subnets[0].[SubnetId]" --output text)
export PubSubnet3=$(aws ec2 describe-subnets --filters Name=tag:Name,Values="$CLUSTER_NAME-Vpc1PublicSubnet3" --query "Subnets[0].[SubnetId]" --output text)
export N1=$(aws ec2 describe-instances --filters "Name=tag:Name,Values=$CLUSTER_NAME-ng1-Node" "Name=availability-zone,Values=ap-northeast-2a" --query 'Reservations[*].Instances[*].PublicIpAddress' --output text)
export N2=$(aws ec2 describe-instances --filters "Name=tag:Name,Values=$CLUSTER_NAME-ng1-Node" "Name=availability-zone,Values=ap-northeast-2b" --query 'Reservations[*].Instances[*].PublicIpAddress' --output text)
export N3=$(aws ec2 describe-instances --filters "Name=tag:Name,Values=$CLUSTER_NAME-ng1-Node" "Name=availability-zone,Values=ap-northeast-2c" --query 'Reservations[*].Instances[*].PublicIpAddress' --output text)
export CERT_ARN=$(aws acm list-certificates --query 'CertificateSummaryList[].CertificateArn[]' --output text) #사용 리전의 인증서 ARN 확인
MyDomain=gasida.link # 각자 자신의 도메인 이름 입력
MyDnzHostedZoneId=$(aws route53 list-hosted-zones-by-name --dns-name "$MyDomain." --query "HostedZones[0].Id" --output text)


# 실습 완료 후 삭제 할 것!
cat << EOF >> ~/.bashrc

# eksworkshop
export CLUSTER_NAME=myeks
export VPCID=$(aws ec2 describe-vpcs --filters "Name=tag:Name,Values=$CLUSTER_NAME-VPC" --query 'Vpcs[*].VpcId' --output text)
export PubSubnet1=$(aws ec2 describe-subnets --filters Name=tag:Name,Values="$CLUSTER_NAME-Vpc1PublicSubnet1" --query "Subnets[0].[SubnetId]" --output text)
export PubSubnet2=$(aws ec2 describe-subnets --filters Name=tag:Name,Values="$CLUSTER_NAME-Vpc1PublicSubnet2" --query "Subnets[0].[SubnetId]" --output text)
export PubSubnet3=$(aws ec2 describe-subnets --filters Name=tag:Name,Values="$CLUSTER_NAME-Vpc1PublicSubnet3" --query "Subnets[0].[SubnetId]" --output text)
export N1=$(aws ec2 describe-instances --filters "Name=tag:Name,Values=$CLUSTER_NAME-ng1-Node" "Name=availability-zone,Values=ap-northeast-2a" --query 'Reservations[*].Instances[*].PublicIpAddress' --output text)
export N2=$(aws ec2 describe-instances --filters "Name=tag:Name,Values=$CLUSTER_NAME-ng1-Node" "Name=availability-zone,Values=ap-northeast-2b" --query 'Reservations[*].Instances[*].PublicIpAddress' --output text)
export N3=$(aws ec2 describe-instances --filters "Name=tag:Name,Values=$CLUSTER_NAME-ng1-Node" "Name=availability-zone,Values=ap-northeast-2c" --query 'Reservations[*].Instances[*].PublicIpAddress' --output text)
export CERT_ARN=$(aws acm list-certificates --query 'CertificateSummaryList[].CertificateArn[]' --output text)
MyDomain=gasida.link # 각자 자신의 도메인 이름 입력
MyDnzHostedZoneId=$(aws route53 list-hosted-zones-by-name --dns-name "$MyDomain." --query "HostedZones[0].Id" --output text)
EOF

# [신규 터미널] 확인
echo $CLUSTER_NAME $VPCID $PubSubnet1 $PubSubnet2 $PubSubnet3
echo $N1 $N2 $N3 $MyDomain $MyDnzHostedZoneId
tail -n 15 ~/.bashrc
☞ AWS LoadBalancer Controller, ExternalDNS, gp3 storageclass, kube-ops-view(Ingress) 설치
- 설치
# AWS LoadBalancerController
helm repo add eks https://aws.github.io/eks-charts
helm install aws-load-balancer-controller eks/aws-load-balancer-controller -n kube-system --set clusterName=$CLUSTER_NAME \
  --set serviceAccount.create=false --set serviceAccount.name=aws-load-balancer-controller

# ExternalDNS
echo $MyDomain
curl -s https://raw.githubusercontent.com/gasida/PKOS/main/aews/externaldns.yaml | MyDomain=$MyDomain MyDnzHostedZoneId=$MyDnzHostedZoneId envsubst | kubectl apply -f -

# gp3 스토리지 클래스 생성
cat <<EOF | kubectl apply -f -
kind: StorageClass
apiVersion: storage.k8s.io/v1
metadata:
  name: gp3
  annotations:
    storageclass.kubernetes.io/is-default-class: "true"
allowVolumeExpansion: true
provisioner: ebs.csi.aws.com
volumeBindingMode: WaitForFirstConsumer
parameters:
  type: gp3
  allowAutoIOPSPerGBIncrease: 'true'
  encrypted: 'true'
  fsType: xfs # 기본값이 ext4
EOF
kubectl get sc


# kube-ops-view
helm repo add geek-cookbook https://geek-cookbook.github.io/charts/
helm install kube-ops-view geek-cookbook/kube-ops-view --version 1.2.2 --set service.main.type=ClusterIP  --set env.TZ="Asia/Seoul" --namespace kube-system

# kubeopsview 용 Ingress 설정 : group 설정으로 1대의 ALB를 여러개의 ingress 에서 공용 사용
echo $CERT_ARN
cat <<EOF | kubectl apply -f -
apiVersion: networking.k8s.io/v1
kind: Ingress
metadata:
  annotations:
    alb.ingress.kubernetes.io/certificate-arn: $CERT_ARN
    alb.ingress.kubernetes.io/group.name: study
    alb.ingress.kubernetes.io/listen-ports: '[{"HTTPS":443}, {"HTTP":80}]'
    alb.ingress.kubernetes.io/load-balancer-name: $CLUSTER_NAME-ingress-alb
    alb.ingress.kubernetes.io/scheme: internet-facing
    alb.ingress.kubernetes.io/ssl-redirect: "443"
    alb.ingress.kubernetes.io/success-codes: 200-399
    alb.ingress.kubernetes.io/target-type: ip
  labels:
    app.kubernetes.io/name: kubeopsview
  name: kubeopsview
  namespace: kube-system
spec:
  ingressClassName: alb
  rules:
  - host: kubeopsview.$MyDomain
    http:
      paths:
      - backend:
          service:
            name: kube-ops-view
            port:
              number: 8080  # name: http
        path: /
        pathType: Prefix
EOF

- 확인
# 설치된 파드 정보 확인
kubectl get pods -n kube-system

# service, ep, ingress 확인
kubectl get ingress,svc,ep -n kube-system

# Kube Ops View 접속 정보 확인 : 조금 오래 기다리면 접속됨...
echo -e "Kube Ops View URL = https://kubeopsview.$MyDomain/#scale=1.5"
#open "https://kubeopsview.$MyDomain/#scale=1.5" # macOS

- AWS LB Ctrl 설치 후 포트 이슈 발생 시 해결

#
kubectl get targetgroupbindings.elbv2.k8s.aws -A
NAMESPACE     NAME                               SERVICE-NAME                       SERVICE-PORT   TARGET-TYPE   AGE
kube-system   k8s-kubesyst-kubeopsv-a484a0c5ec   kube-ops-view                      8080           ip            17m
monitoring    k8s-monitori-kubeprom-37d09d3044   kube-prometheus-stack-grafana      80             ip            12m
monitoring    k8s-monitori-kubeprom-ba27a9dbfd   kube-prometheus-stack-prometheus   9090           ip            12m

#
kubectl describe targetgroupbindings.elbv2.k8s.aws -n monitoring
...
Spec:
  Ip Address Type:  ipv4
  Networking:
    Ingress:
      From:
        Security Group:
          Group ID:  sg-0ec90ea2a51ad8da5
      Ports:
        Port:      9090
        Protocol:  TCP
  Service Ref:
    Name:            kube-prometheus-stack-prometheus
    Port:            9090
  Target Group ARN:  arn:aws:elasticloadbalancing:ap-northeast-2:911283464785:targetgroup/k8s-monitori-kubeprom-ba27a9dbfd/d1fd208921747c04
  Target Type:       ip
  Vpc ID:            vpc-048f2b4557b09f5b4
...

#
kubectl describe targetgroupbindings.elbv2.k8s.aws -n kube-system
...
Spec:
  Ip Address Type:  ipv4
  Networking:
    Ingress:
      From:
        Security Group:
          Group ID:  sg-0ec90ea2a51ad8da5
      Ports:
        Port:      http
        Protocol:  TCP
  Service Ref:
    Name:            kube-ops-view
    Port:            8080
  Target Group ARN:  arn:aws:elasticloadbalancing:ap-northeast-2:911283464785:targetgroup/k8s-kubesyst-kubeopsv-a484a0c5ec/314038dae8b4cb05
  Target Type:       ip
  Vpc ID:            vpc-048f2b4557b09f5b4
...

kubectl get pod -n kube-system -l app.kubernetes.io/instance=kube-ops-view -o json | jq
kubectl get pod -n kube-system -l app.kubernetes.io/instance=kube-ops-view -o jsonpath="{.items[0].spec.containers[0].ports[0]}" | jq
{
  "containerPort": 8080,
  "name": "http",
  "protocol": "TCP"
}
☞ 프로메테우스 & 그라파나(admin / prom-operator) 설치 : 대시보드 Import 17900 - Link
# repo 추가
helm repo add prometheus-community https://prometheus-community.github.io/helm-charts
# 파라미터 파일 생성 : PV/PVC(AWS EBS) 삭제에 불편하니, 4주차 실습과 다르게 PV/PVC 미사용
cat <<EOT > monitor-values.yaml
prometheus:
prometheusSpec:
scrapeInterval: "15s"
evaluationInterval: "15s"
podMonitorSelectorNilUsesHelmValues: false
serviceMonitorSelectorNilUsesHelmValues: false
retention: 5d
retentionSize: "10GiB"
# Enable vertical pod autoscaler support for prometheus-operator
verticalPodAutoscaler:
enabled: true
ingress:
enabled: true
ingressClassName: alb
hosts:
- prometheus.$MyDomain
paths:
- /*
annotations:
alb.ingress.kubernetes.io/scheme: internet-facing
alb.ingress.kubernetes.io/target-type: ip
alb.ingress.kubernetes.io/listen-ports: '[{"HTTPS":443}, {"HTTP":80}]'
alb.ingress.kubernetes.io/certificate-arn: $CERT_ARN
alb.ingress.kubernetes.io/success-codes: 200-399
alb.ingress.kubernetes.io/load-balancer-name: myeks-ingress-alb
alb.ingress.kubernetes.io/group.name: study
alb.ingress.kubernetes.io/ssl-redirect: '443'
grafana:
defaultDashboardsTimezone: Asia/Seoul
adminPassword: prom-operator
defaultDashboardsEnabled: false
ingress:
enabled: true
ingressClassName: alb
hosts:
- grafana.$MyDomain
paths:
- /*
annotations:
alb.ingress.kubernetes.io/scheme: internet-facing
alb.ingress.kubernetes.io/target-type: ip
alb.ingress.kubernetes.io/listen-ports: '[{"HTTPS":443}, {"HTTP":80}]'
alb.ingress.kubernetes.io/certificate-arn: $CERT_ARN
alb.ingress.kubernetes.io/success-codes: 200-399
alb.ingress.kubernetes.io/load-balancer-name: myeks-ingress-alb
alb.ingress.kubernetes.io/group.name: study
alb.ingress.kubernetes.io/ssl-redirect: '443'
kube-state-metrics:
rbac:
extraRules:
- apiGroups: ["autoscaling.k8s.io"]
resources: ["verticalpodautoscalers"]
verbs: ["list", "watch"]
customResourceState:
enabled: true
config:
kind: CustomResourceStateMetrics
spec:
resources:
- groupVersionKind:
group: autoscaling.k8s.io
kind: "VerticalPodAutoscaler"
version: "v1"
labelsFromPath:
verticalpodautoscaler: [metadata, name]
namespace: [metadata, namespace]
target_api_version: [apiVersion]
target_kind: [spec, targetRef, kind]
target_name: [spec, targetRef, name]
metrics:
- name: "vpa_containerrecommendations_target"
help: "VPA container recommendations for memory."
each:
type: Gauge
gauge:
path: [status, recommendation, containerRecommendations]
valueFrom: [target, memory]
labelsFromPath:
container: [containerName]
commonLabels:
resource: "memory"
unit: "byte"
- name: "vpa_containerrecommendations_target"
help: "VPA container recommendations for cpu."
each:
type: Gauge
gauge:
path: [status, recommendation, containerRecommendations]
valueFrom: [target, cpu]
labelsFromPath:
container: [containerName]
commonLabels:
resource: "cpu"
unit: "core"
selfMonitor:
enabled: true
alertmanager:
enabled: false
defaultRules:
create: false
kubeControllerManager:
enabled: false
kubeEtcd:
enabled: false
kubeScheduler:
enabled: false
prometheus-windows-exporter:
prometheus:
monitor:
enabled: false
EOT
cat monitor-values.yaml
# helm 배포
helm install kube-prometheus-stack prometheus-community/kube-prometheus-stack --version 69.3.1 \
-f monitor-values.yaml --create-namespace --namespace monitoring
# helm 확인
helm get values -n monitoring kube-prometheus-stack
# PV 사용하지 않음
kubectl get pv,pvc -A
kubectl df-pv
# 프로메테우스 웹 접속
echo -e "https://prometheus.$MyDomain"
open "https://prometheus.$MyDomain" # macOS
# 그라파나 웹 접속 : admin / prom-operator
echo -e "https://grafana.$MyDomain"
open "https://grafana.$MyDomain" # macOS
#
kubectl get targetgroupbindings.elbv2.k8s.aws -A
# 상세 확인
kubectl get pod -n monitoring -l app.kubernetes.io/name=kube-state-metrics
kubectl describe pod -n monitoring -l app.kubernetes.io/name=kube-state-metrics
...
Service Account: kube-prometheus-stack-kube-state-metrics
...
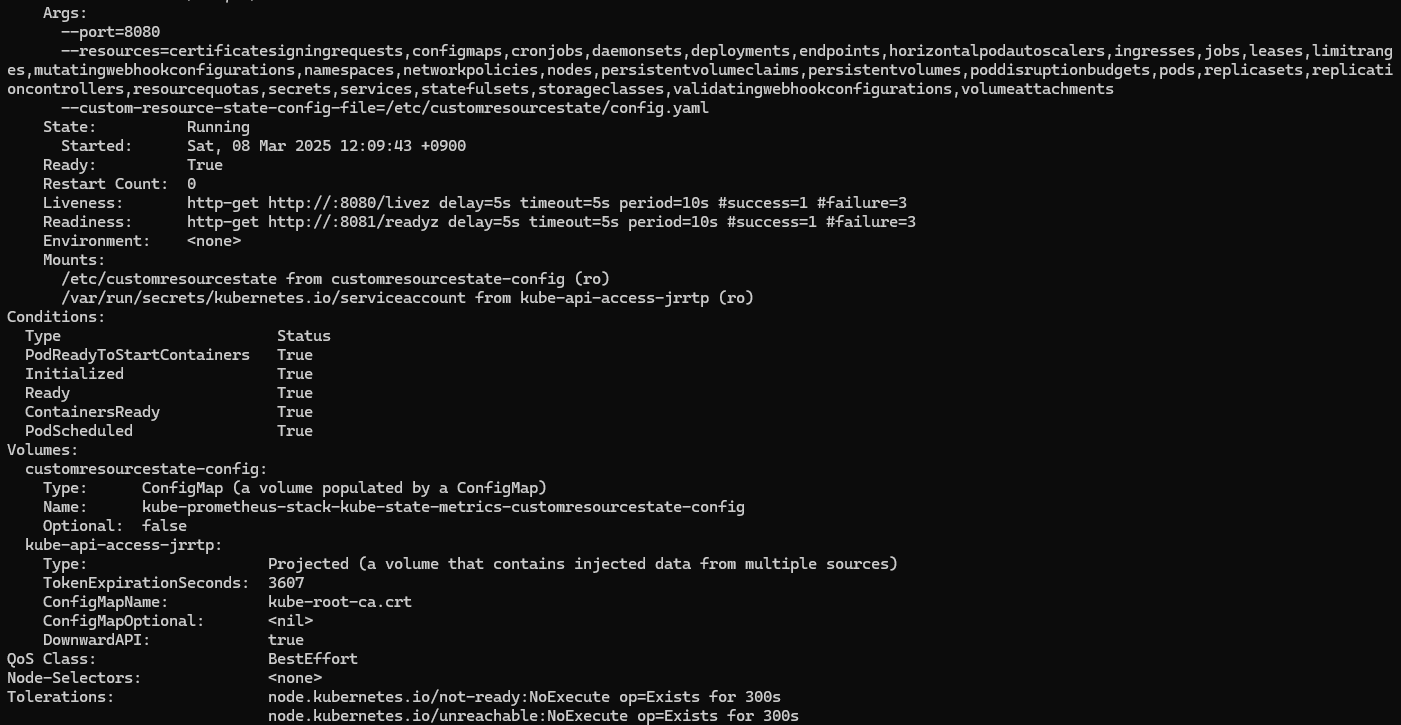
Args:
--port=8080
--resources=certificatesigningrequests,configmaps,cronjobs,daemonsets,deployments,endpoints,horizontalpodautoscalers,ingresses,jobs,leases,limitranges,mutatingwebhookconfigurations,namespaces,networkpolicies,nodes,persistentvolumeclaims,persistentvolumes,poddisruptionbudgets,pods,replicasets,replicationcontrollers,resourcequotas,secrets,services,statefulsets,storageclasses,validatingwebhookconfigurations,volumeattachments
--custom-resource-state-config-file=/etc/customresourcestate/config.yaml
...
Volumes:
customresourcestate-config:
Type: ConfigMap (a volume populated by a ConfigMap)
Name: kube-prometheus-stack-kube-state-metrics-customresourcestate-config
Optional: false
...
kubectl describe cm -n monitoring kube-prometheus-stack-kube-state-metrics-customresourcestate-config
...
#
kubectl get clusterrole kube-prometheus-stack-kube-state-metrics
kubectl describe clusterrole kube-prometheus-stack-kube-state-metrics
kubectl describe clusterrole kube-prometheus-stack-kube-state-metrics | grep verticalpodautoscalers
verticalpodautoscalers.autoscaling.k8s.io [] [] [list watch]


- (옵션) 4주차 노션 확인하여 17900 대시보드에 PromQL/Variables 수정 해둘 것
☞ EKS Node Viewer : 노드 할당 가능 용량과 요청 request 리소스 표시, 실제 파드 리소스 사용량 X - 링크
- 동작
- It displays the scheduled pod resource requests vs the allocatable capacity on the node.
- It does not look at the actual pod resource usage.
- Node마다 할당 가능한 용량과 스케줄링된 POD(컨테이너)의 Resource 중 request 값을 표시한다.
- 실제 POD(컨테이너) 리소스 사용량은 아니다. /pkg/model/pod.go 파일을 보면 컨테이너의 request 합을 반환하며, init containers는 미포함
- https://github.com/awslabs/eks-node-viewer/blob/main/pkg/model/pod.go#L82
// Requested returns the sum of the resources requested by the pod. This doesn't include any init containers as we
// are interested in the steady state usage of the pod
func (p *Pod) Requested() v1.ResourceList {
	p.mu.RLock()
	defer p.mu.RUnlock()
	requested := v1.ResourceList{}
	for _, c := range p.pod.Spec.Containers {
		for rn, q := range c.Resources.Requests {
			existing := requested[rn]
			existing.Add(q)
			requested[rn] = existing
		}
	}
	requested[v1.ResourcePods] = resource.MustParse("1")
	return requested
}- 설치
# macOS 설치
# brew tap aws/tap
# brew install eks-node-viewer

# 운영서버 EC2에 설치 : userdata 통해 이미 설치 되어 있음
# yum install golang -y
go install github.com/awslabs/eks-node-viewer/cmd/eks-node-viewer@latest  # 설치 시 2~3분 정도 소요

# Windows 에 WSL2 (Ubuntu) 설치
sudo apt install golang-go
go install github.com/awslabs/eks-node-viewer/cmd/eks-node-viewer@latest  # 설치 시 2~3분 정도 소요
echo 'export PATH="$PATH:/root/go/bin"' >> /etc/profile
# echo 'export PATH="$PATH:/home/user1/root/go/bin"' >> /etc/profile- 사용
# Standard usage
eks-node-viewer

# Display both CPU and Memory Usage
eks-node-viewer --resources cpu,memory
eks-node-viewer --resources cpu,memory --extra-labels eks-node-viewer/node-age

# Display extra labels, i.e. AZ : node 에 labels 사용 가능
eks-node-viewer --extra-labels topology.kubernetes.io/zone
eks-node-viewer --extra-labels kubernetes.io/arch

# Sort by CPU usage in descending order
eks-node-viewer --node-sort=eks-node-viewer/node-cpu-usage=dsc

# Karenter nodes only
eks-node-viewer --node-selector "karpenter.sh/provisioner-name"

# Specify a particular AWS profile and region
AWS_PROFILE=myprofile AWS_REGION=us-west-2


Computed Labels : --extra-labels
# eks-node-viewer/node-age - Age of the node
eks-node-viewer --extra-labels eks-node-viewer/node-age
eks-node-viewer --extra-labels topology.kubernetes.io/zone,eks-node-viewer/node-age

# eks-node-viewer/node-ephemeral-storage-usage - Ephemeral Storage usage (requests)
eks-node-viewer --extra-labels eks-node-viewer/node-ephemeral-storage-usage

# eks-node-viewer/node-cpu-usage - CPU usage (requests)
eks-node-viewer --extra-labels eks-node-viewer/node-cpu-usage

# eks-node-viewer/node-memory-usage - Memory usage (requests)
eks-node-viewer --extra-labels eks-node-viewer/node-memory-usage

# eks-node-viewer/node-pods-usage - Pod usage (requests)
eks-node-viewer --extra-labels eks-node-viewer/node-pods-usage


1. HPA - Horizontal Pod Autoscaler
☞ 실습 : kube-ops-view 와 그라파나(22128 , 22251)에서 모니터링 - Docs , K8S , AWS
(참고) hpa-example : Dockerfile , index.php (CPU 과부하 연산 수행 , 100만번 덧셈 수행)
FROM php:5-apache
COPY index.php /var/www/html/index.php
RUN chmod a+rx index.php
<?php
$x = 0.0001;
for ($i = 0; $i <= 1000000; $i++) {
$x += sqrt($x);
}
echo "OK!";
?>
# Run and expose php-apache server
cat << EOF > php-apache.yaml
apiVersion: apps/v1
kind: Deployment
metadata:
  name: php-apache
spec:
  selector:
    matchLabels:
      run: php-apache
  template:
    metadata:
      labels:
        run: php-apache
    spec:
      containers:
      - name: php-apache
        image: registry.k8s.io/hpa-example
        ports:
        - containerPort: 80
        resources:
          limits:
            cpu: 500m
          requests:
            cpu: 200m
---
apiVersion: v1
kind: Service
metadata:
  name: php-apache
  labels:
    run: php-apache
spec:
  ports:
  - port: 80
  selector:
    run: php-apache
EOF
kubectl apply -f php-apache.yaml

# 확인
kubectl exec -it deploy/php-apache -- cat /var/www/html/index.php
...

# 모니터링 : 터미널2개 사용
watch -d 'kubectl get hpa,pod;echo;kubectl top pod;echo;kubectl top node'
kubectl exec -it deploy/php-apache -- top

# [운영서버 EC2] 파드IP로 직접 접속
PODIP=$(kubectl get pod -l run=php-apache -o jsonpath="{.items[0].status.podIP}")
curl -s $PODIP; echo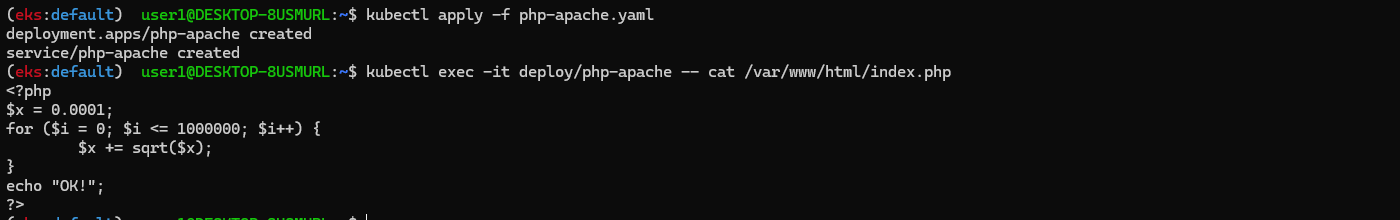
- HPA 정책 생성 및 부하 발생 후 오토 스케일링 테스트 : 증가 시 기본 대기 시간(30초), 감소 시 기본 대기 시간(5분) → 조정 가능
# Create the HorizontalPodAutoscaler : requests.cpu=200m - 알고리즘
# Since each pod requests 200 milli-cores by kubectl run, this means an average CPU usage of 100 milli-cores.
cat <<EOF | kubectl apply -f -
apiVersion: autoscaling/v2
kind: HorizontalPodAutoscaler
metadata:
name: php-apache
spec:
scaleTargetRef:
apiVersion: apps/v1
kind: Deployment
name: php-apache
minReplicas: 1
maxReplicas: 10
metrics:
- type: Resource
resource:
name: cpu
target:
averageUtilization: 50
type: Utilization
EOF
혹은
kubectl autoscale deployment php-apache --cpu-percent=50 --min=1 --max=10
# 확인
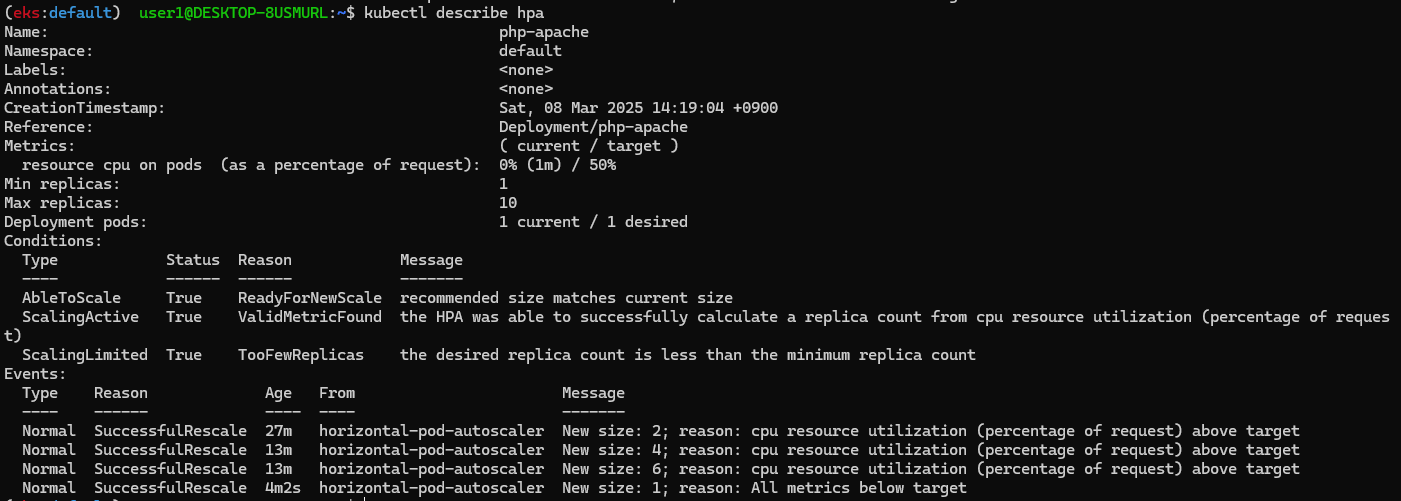
kubectl describe hpa
...
Metrics: ( current / target )
resource cpu on pods (as a percentage of request): 0% (1m) / 50%
Min replicas: 1
Max replicas: 10
Deployment pods: 1 current / 1 desired
...
# HPA 설정 확인
kubectl get hpa php-apache -o yaml | kubectl neat
spec:
minReplicas: 1 # [4] 또는 최소 1개까지 줄어들 수도 있습니다
maxReplicas: 10 # [3] 포드를 최대 10개까지 늘립니다
scaleTargetRef:
apiVersion: apps/v1
kind: Deployment
name: php-apache # [1] php-apache 의 자원 사용량에서
metrics:
- type: Resource
resource:
name: cpu
target:
type: Utilization
averageUtilization: 50 # [2] CPU 활용률이 50% 이상인 경우
# 반복 접속 1 (파드1 IP로 접속) >> 증가 확인 후 중지
while true;do curl -s $PODIP; sleep 0.5; done
# 반복 접속 2 (서비스명 도메인으로 파드들 분산 접속) >> 증가 확인(몇개까지 증가되는가? 그 이유는?) 후 중지
## >> [scale back down] 중지 5분 후 파드 갯수 감소 확인
# Run this in a separate terminal
# so that the load generation continues and you can carry on with the rest of the steps
kubectl run -i --tty load-generator --rm --image=busybox:1.28 --restart=Never -- /bin/sh -c "while sleep 0.01; do wget -q -O- http://php-apache; done"
# Horizontal Pod Autoscaler Status Conditions
kubectl describe hpa
...
Events:
Type Reason Age From Message
---- ------ ---- ---- -------
Normal SuccessfulRescale 13m horizontal-pod-autoscaler New size: 2; reason: cpu resource utilization (percentage of request) above target
Normal SuccessfulRescale 11m horizontal-pod-autoscaler New size: 3; reason: cpu resource utilization (percentage of request) above target
Normal SuccessfulRescale 11m horizontal-pod-autoscaler New size: 6; reason: cpu resource utilization (percentage of request) above target
Normal SuccessfulRescale 10m horizontal-pod-autoscaler New size: 8; reason: cpu resource utilization (percentage of request) above target
Normal SuccessfulRescale 5m35s horizontal-pod-autoscaler New size: 7; reason: All metrics below target
Normal SuccessfulRescale 4m35s horizontal-pod-autoscaler New size: 5; reason: All metrics below target
Normal SuccessfulRescale 4m5s horizontal-pod-autoscaler New size: 2; reason: All metrics below target
Normal SuccessfulRescale 3m50s horizontal-pod-autoscaler New size: 1; reason: All metrics below target


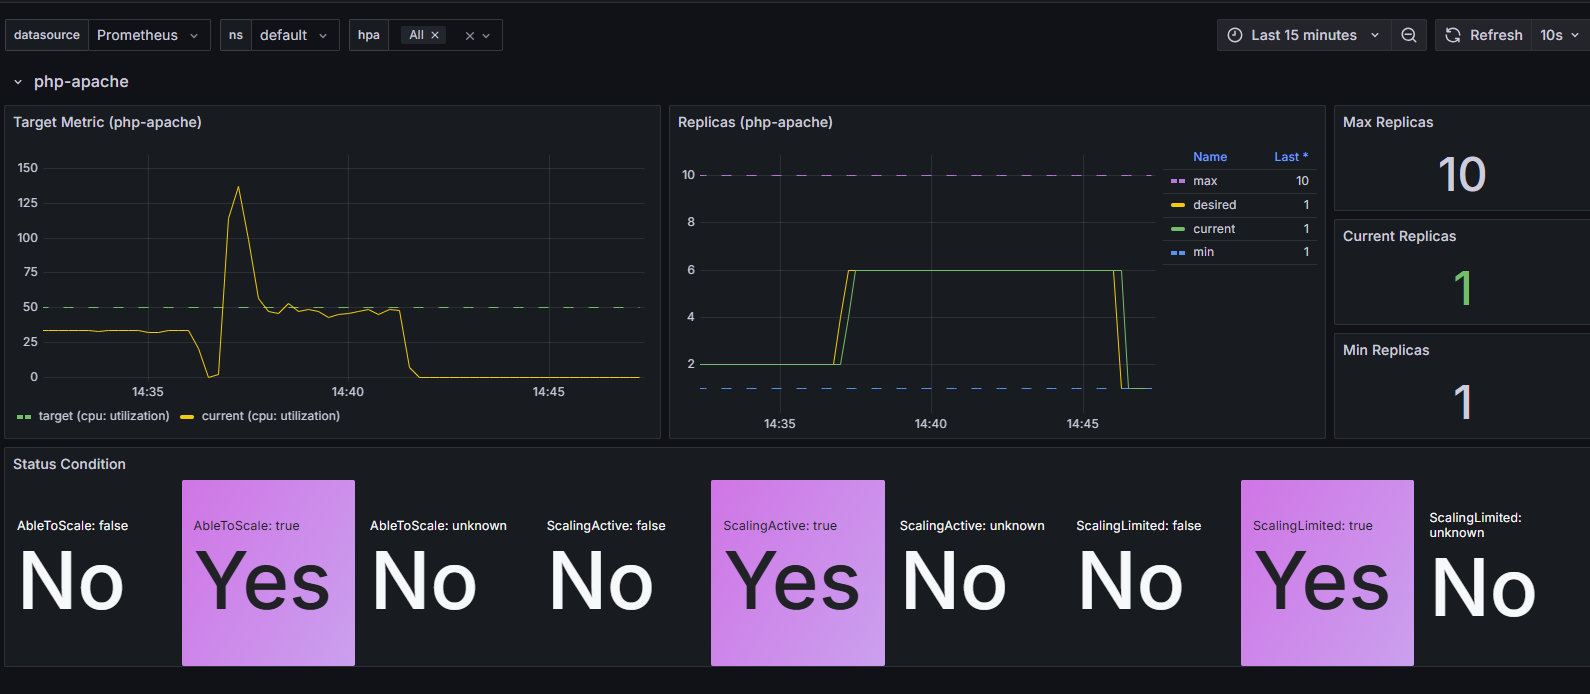

- HPA 프로메테우스 메트릭
kube_horizontalpodautoscaler_status_current_replicas
kube_horizontalpodautoscaler_status_desired_replicas
kube_horizontalpodautoscaler_status_target_metric
kube_horizontalpodautoscaler_status_condition

kube_horizontalpodautoscaler_spec_target_metric
kube_horizontalpodautoscaler_spec_min_replicas
kube_horizontalpodautoscaler_spec_max_replicas

# [운영서버 EC2]
kubectl get pod -n monitoring -l app.kubernetes.io/name=kube-state-metrics -owide
kubectl get pod -n monitoring -l app.kubernetes.io/name=kube-state-metrics -o jsonpath="{.items[*].status.podIP}"
PODIP=$(kubectl get pod -n monitoring -l app.kubernetes.io/name=kube-state-metrics -o jsonpath="{.items[*].status.podIP}")
curl -s http://$PODIP:8080/metrics | grep -i horizontalpodautoscaler | grep HELP
# HELP kube_horizontalpodautoscaler_info Information about this autoscaler.
# HELP kube_horizontalpodautoscaler_metadata_generation [STABLE] The generation observed by the HorizontalPodAutoscaler controller.
# HELP kube_horizontalpodautoscaler_spec_max_replicas [STABLE] Upper limit for the number of pods that can be set by the autoscaler; cannot be smaller than MinReplicas.
# HELP kube_horizontalpodautoscaler_spec_min_replicas [STABLE] Lower limit for the number of pods that can be set by the autoscaler, default 1.
# HELP kube_horizontalpodautoscaler_spec_target_metric The metric specifications used by this autoscaler when calculating the desired replica count.
# HELP kube_horizontalpodautoscaler_status_target_metric The current metric status used by this autoscaler when calculating the desired replica count.
# HELP kube_horizontalpodautoscaler_status_current_replicas [STABLE] Current number of replicas of pods managed by this autoscaler.
# HELP kube_horizontalpodautoscaler_status_desired_replicas [STABLE] Desired number of replicas of pods managed by this autoscaler.
# HELP kube_horizontalpodautoscaler_annotations Kubernetes annotations converted to Prometheus labels.
# HELP kube_horizontalpodautoscaler_labels [STABLE] Kubernetes labels converted to Prometheus labels.
# HELP kube_horizontalpodautoscaler_status_condition [STABLE] The condition of this autoscaler.

curl -s http://$PODIP:8080/metrics | grep -i horizontalpodautoscaler
...


- 관련 오브젝트 삭제: kubectl delete deploy,svc,hpa,pod --all
2. KEDA - Kubernetes based Event Driven Autoscaler
☞ KEDA AutoScaler 소개 - Docs , DevOcean
기존의 HPA(Horizontal Pod Autoscaler)는 리소스(CPU, Memory) 메트릭을 기반으로 스케일 여부를 결정하게 됩니다.
반면에 KEDA는 특정 이벤트를 기반으로 스케일 여부를 결정할 수 있습니다.
예를 들어 airflow는 metadb를 통해 현재 실행 중이거나 대기 중인 task가 얼마나 존재하는지 알 수 있습니다.
이러한 이벤트를 활용하여 worker의 scale을 결정한다면 queue에 task가 많이 추가되는 시점에 더 빠르게 확장할 수 있습니다.

- Agent — KEDA는 이벤트가 없을 때 Kubernetes 배포(Deployments)를 활성화하고 비활성화하여 0까지 축소할 수 있도록 합니다. 이것은 KEDA를 설치할 때 실행되는 keda-operator 컨테이너의 주요 역할 중 하나입니다.
- Metrics — KEDA는 Kubernetes 메트릭 서버로 작동하여 큐 길이(queue length) 또는 스트림 지연(stream lag)과 같은 풍부한 이벤트 데이터를 Horizontal Pod Autoscaler(HPA)에 제공하여 확장을 유도합니다. 배포(Deployment)는 이벤트를 직접 소스에서 소비해야 합니다. 이를 통해 큐 메시지를 완료하거나 포기하는 등의 동작이 기본적으로 작동할 수 있도록 풍부한 이벤트 통합을 유지합니다. 메트릭 제공(metric serving)은 KEDA를 설치할 때 실행되는 keda-operator-metrics-apiserver 컨테이너의 주요 역할입니다.
- Admission Webhooks - Admission controller를 사용하여 리소스 변경 사항을 자동으로 검증하고 **잘못된 구성(misconfiguration)**을 방지하며 최적의 설정을 유지합니다. 예를 들어, 동일한 ScaleTarget을 대상으로 여러 ScaledObject가 지정되는 것을 방지합니다. keda-admission-webhooks
kubectl get pod -n keda
NAME                                               READY   STATUS    RESTARTS      AGE
keda-operator-6bdffdc78-5rqnp                      1/1     Running   1 (11m ago)   11m
keda-operator-metrics-apiserver-74d844d769-2vrcq   1/1     Running   0             11m
keda-admission-webhooks-86cffccbf5-kmb7v           1/1     Running   0             11m
예) KEDA Scalers : kafka trigger for an Apache Kafka topic - Link
triggers:
- type: kafka
  metadata:
    bootstrapServers: kafka.svc:9092
    consumerGroup: my-group
    topic: test-topic
    lagThreshold: '5' # Average target value to trigger scaling actions. (Default: 5, Optional)
    activationLagThreshold: '3' #  Target value for activating the scaler. Learn more about activation here.
    offsetResetPolicy: latest
    allowIdleConsumers: false
    scaleToZeroOnInvalidOffset: false
    excludePersistentLag: false
    limitToPartitionsWithLag: false
    version: 1.0.0
    partitionLimitation: '1,2,10-20,31'
    sasl: plaintext
    tls: enable
    unsafeSsl: 'false'
☞ KEDA with Helm : 특정 이벤트(cron 등)기반의 파드 오토 스케일링 - Chart , Grafana , Cron , SQS_Scale , aws-sqs-queue
# 설치 전 기존 metrics-server 제공 Metris API 확인
kubectl get --raw "/apis/metrics.k8s.io" -v=6 | jq
kubectl get --raw "/apis/metrics.k8s.io" | jq
{
  "kind": "APIGroup",
  "apiVersion": "v1",
  "name": "metrics.k8s.io",
  ...


# KEDA 설치 : serviceMonitor 만으로도 충분할듯..
cat <<EOT > keda-values.yaml
metricsServer:
  useHostNetwork: true

prometheus:
  metricServer:
    enabled: true
    port: 9022
    portName: metrics
    path: /metrics
    serviceMonitor:
      # Enables ServiceMonitor creation for the Prometheus Operator
      enabled: true
    podMonitor:
      # Enables PodMonitor creation for the Prometheus Operator
      enabled: true
  operator:
    enabled: true
    port: 8080
    serviceMonitor:
      # Enables ServiceMonitor creation for the Prometheus Operator
      enabled: true
    podMonitor:
      # Enables PodMonitor creation for the Prometheus Operator
      enabled: true
  webhooks:
    enabled: true
    port: 8020
    serviceMonitor:
      # Enables ServiceMonitor creation for the Prometheus webhooks
      enabled: true
EOT

helm repo add kedacore https://kedacore.github.io/charts
helm repo update
helm install keda kedacore/keda --version 2.16.0 --namespace keda --create-namespace -f keda-values.yaml

# KEDA 설치 확인
kubectl get crd | grep keda
kubectl get all -n keda
kubectl get validatingwebhookconfigurations keda-admission -o yaml
kubectl get podmonitor,servicemonitors -n keda
kubectl get apiservice v1beta1.external.metrics.k8s.io -o yaml

# CPU/Mem은 기존 metrics-server 의존하여, KEDA metrics-server는 외부 이벤트 소스(Scaler) 메트릭을 노출
## https://keda.sh/docs/2.16/operate/metrics-server/
kubectl get pod -n keda -l app=keda-operator-metrics-apiserver

# Querying metrics exposed by KEDA Metrics Server
kubectl get --raw "/apis/external.metrics.k8s.io/v1beta1" | jq
{
  "kind": "APIResourceList",
  "apiVersion": "v1",
  "groupVersion": "external.metrics.k8s.io/v1beta1",
  "resources": [
    {
      "name": "externalmetrics",
      "singularName": "",
      "namespaced": true,
      "kind": "ExternalMetricValueList",
      "verbs": [
        "get"
      ]
    }
  ]
}

# keda 네임스페이스에 디플로이먼트 생성
kubectl apply -f php-apache.yaml -n keda
kubectl get pod -n keda

# ScaledObject 정책 생성 : cron
cat <<EOT > keda-cron.yaml
apiVersion: keda.sh/v1alpha1
kind: ScaledObject
metadata:
  name: php-apache-cron-scaled
spec:
  minReplicaCount: 0
  maxReplicaCount: 2  # Specifies the maximum number of replicas to scale up to (defaults to 100).
  pollingInterval: 30  # Specifies how often KEDA should check for scaling events
  cooldownPeriod: 300  # Specifies the cool-down period in seconds after a scaling event
  scaleTargetRef:  # Identifies the Kubernetes deployment or other resource that should be scaled.
    apiVersion: apps/v1
    kind: Deployment
    name: php-apache
  triggers:  # Defines the specific configuration for your chosen scaler, including any required parameters or settings
  - type: cron
    metadata:
      timezone: Asia/Seoul
      start: 00,15,30,45 * * * *
      end: 05,20,35,50 * * * *
      desiredReplicas: "1"
EOT
kubectl apply -f keda-cron.yaml -n keda

# 그라파나 대시보드 추가 : 대시보드 상단에 namespace : keda 로 변경하기!
# KEDA 대시보드 Import : https://github.com/kedacore/keda/blob/main/config/grafana/keda-dashboard.json

# 모니터링
watch -d 'kubectl get ScaledObject,hpa,pod -n keda'
kubectl get ScaledObject -w

# 확인
kubectl get ScaledObject,hpa,pod -n keda
kubectl get hpa -o jsonpath="{.items[0].spec}" -n keda | jq
...
"metrics": [
    {
      "external": {
        "metric": {
          "name": "s0-cron-Asia-Seoul-00,15,30,45xxxx-05,20,35,50xxxx",
          "selector": {
            "matchLabels": {
              "scaledobject.keda.sh/name": "php-apache-cron-scaled"
            }
          }
        },
        "target": {
          "averageValue": "1",
          "type": "AverageValue"
        }
      },
      "type": "External"
    }

# KEDA 및 deployment 등 삭제
kubectl delete ScaledObject -n keda php-apache-cron-scaled && kubectl delete deploy php-apache -n keda && helm uninstall keda -n keda
kubectl delete namespace keda


[추천 글] if(kakaoAI)2024] 카카오페이증권의 Kubernetes 지능형 리소스 최적화 - Blog , Youtube , PPT
3. VPA - Vertical Pod Autoscaler
- VPA 소개 : pod resources.request을 최대한 최적값으로 수정 ⇒ 악분님 블로그에서 기본 소개
- VPA는 HPA와 같이 사용할 수 없습니다.
- VPA는 pod자원을 최적값으로 수정하기 위해 pod를 재실행(기존 pod를 종료하고 새로운 pod실행)합니다.
- 계산 방식 : ‘기준값(파드가 동작하는데 필요한 최소한의 값)’ 결정 → ‘마진(약간의 적절한 버퍼)’ 추가 → 상세정리 Link


- 그라파나 대시보드 : 상단 cluster 는 현재 프로메테우스 메트릭 label에 없으니 무시해도됨! - 링크 14588

- 프로메테우스
kube_customresource_vpa_containerrecommendations_target
kube_customresource_vpa_containerrecommendations_target{resource="cpu"}
kube_customresource_vpa_containerrecommendations_target{resource="memory"}
# [운영서버 EC2] 코드 다운로드
git clone https://github.com/kubernetes/autoscaler.git # userdata 로 설치 되어 있음
cd ~/autoscaler/vertical-pod-autoscaler/
tree hack

# openssl 버전 확인
openssl version
OpenSSL 1.0.2k-fips  26 Jan 2017

# 1.0 제거
yum remove openssl -y

# openssl 1.1.1 이상 버전 확인
yum install openssl11 -y
openssl11 version
OpenSSL 1.1.1g FIPS  21 Apr 2020

# 스크립트파일내에 openssl11 수정
sed -i 's/openssl/openssl11/g' ~/autoscaler/vertical-pod-autoscaler/pkg/admission-controller/gencerts.sh
git status
git config --global user.email "you@example.com"
git config --global user.name "Your Name"
git add .
git commit -m "openssl version modify"

# Deploy the Vertical Pod Autoscaler to your cluster with the following command.
watch -d kubectl get pod -n kube-system
cat hack/vpa-up.sh
./hack/vpa-up.sh

# 재실행!
sed -i 's/openssl/openssl11/g' ~/autoscaler/vertical-pod-autoscaler/pkg/admission-controller/gencerts.sh
./hack/vpa-up.sh

kubectl get crd | grep autoscaling
kubectl get mutatingwebhookconfigurations vpa-webhook-config
kubectl get mutatingwebhookconfigurations vpa-webhook-config -o json | jq
- 공식 예제 : pod가 실행되면 약 2~3분 뒤에 pod resource.reqeust가 VPA에 의해 수정 - 링크
- vpa에 spec.updatePolicy.updateMode를 Off 로 변경 시 파드에 Spec을 자동으로 변경 재실행 하지 않습니다. 기본값(Auto)
# 모니터링
watch -d "kubectl top pod;echo "----------------------";kubectl describe pod | grep Requests: -A2"

# 공식 예제 배포
cd ~/autoscaler/vertical-pod-autoscaler/
cat examples/hamster.yaml
kubectl apply -f examples/hamster.yaml && kubectl get vpa -w

# 파드 리소스 Requestes 확인
kubectl describe pod | grep Requests: -A2
    Requests:
      cpu:        442m
      memory:     262144k
--
    Requests:
      cpu:        511m
      memory:     262144k

# VPA에 의해 기존 파드 삭제되고 신규 파드가 생성됨
kubectl get events --sort-by=".metadata.creationTimestamp" | grep VPA
72s         Normal   EvictedByVPA        pod/hamster-598b78f579-k7tv6        Pod was evicted by VPA Updater to apply resource recommendation.
72s         Normal   EvictedPod          verticalpodautoscaler/hamster-vpa   VPA Updater evicted Pod hamster-598b78f579-k7tv6 to apply resource recommendation.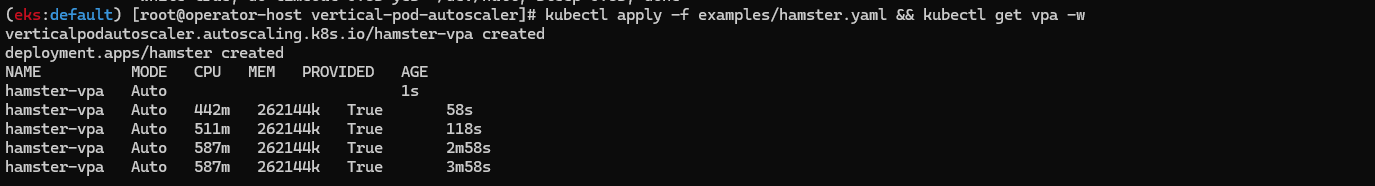

- 삭제: kubectl delete -f examples/hamster.yaml && cd ~/autoscaler/vertical-pod-autoscaler/ && ./hack/vpa-down.sh
4. CAS - Cluster Autoscaler
☞ 구성 소개 - Github , AWS , example
- Kubernetes 클러스터의 크기를 자동으로 조정하여 모든 파드가 실행될 수 있도록 하고 불필요한 노드가 존재하지 않도록 하는 구성 요소입니다. 여러 퍼블릭 클라우드 제공업체를 지원합니다. 버전 1.0(GA)은 Kubernetes 1.8과 함께 출시되었습니다.
- Kubernetes Cluster Autoscaler는 다음 조건 중 하나가 충족될 때 클러스터의 크기를 자동으로 조정합니다:
- 클러스터 내에서 리소스 부족으로 인해 실행되지 못하는 파드가 있을 경우.
- 클러스터 내에서 장기간 활용도가 낮은 노드가 존재하며, 해당 노드의 파드가 다른 기존 노드로 이동할 수 있을 경우.
- AWS에서 Cluster Autoscaler는 Amazon EC2 Auto Scaling Groups를 활용하여 노드 그룹을 관리합니다. Cluster Autoscaler는 일반적으로 클러스터 내에서 Deployment로 실행됩니다.

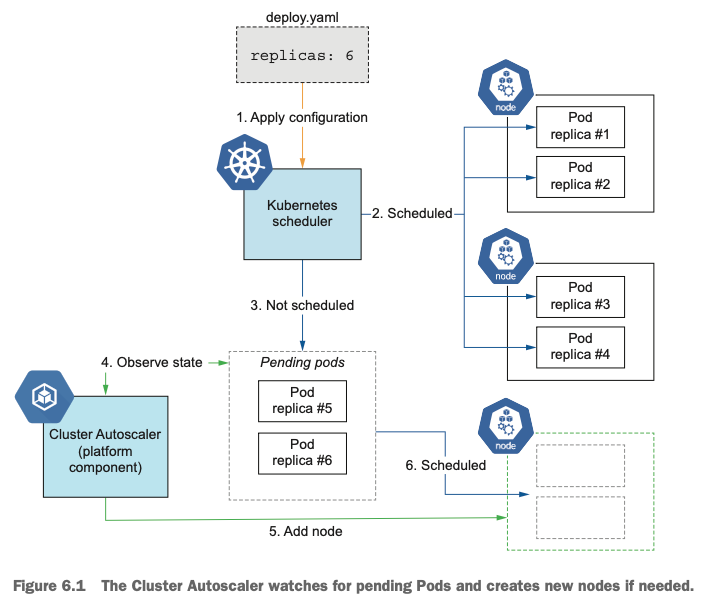
- Cluster Autoscale 동작을 하기 위한 cluster-autoscaler 파드(디플로이먼트)를 배치합니다.
- Cluster Autoscaler(CAS)는 pending 상태인 파드가 존재할 경우, 워커 노드를 스케일 아웃합니다.
- 특정 시간을 간격으로 사용률을 확인하여 스케일 인/아웃을 수행합니다. 그리고 AWS에서는 Auto Scaling Group(ASG)을 사용하여 Cluster Autoscaler를 적용합니다.
☞ Cluster Autoscaler(CAS) 설정 - Workshop , Helm
설정 전 확인
# EKS 노드에 이미 아래 tag가 들어가 있음
# k8s.io/cluster-autoscaler/enabled : true
# k8s.io/cluster-autoscaler/myeks : owned
aws ec2 describe-instances  --filters Name=tag:Name,Values=$CLUSTER_NAME-ng1-Node --query "Reservations[*].Instances[*].Tags[*]" --output json | jq
aws ec2 describe-instances  --filters Name=tag:Name,Values=$CLUSTER_NAME-ng1-Node --query "Reservations[*].Instances[*].Tags[*]" --output yaml
...
- Key: k8s.io/cluster-autoscaler/myeks
      Value: owned
- Key: k8s.io/cluster-autoscaler/enabled
      Value: 'true'
...

AWS용 Cluster Autoscaler는 Auto Scaling 그룹과의 통합을 제공합니다. 이를 통해 사용자는 네 가지 다른 배포 옵션 중에서 선택할 수 있습니다.
- One Auto Scaling group
- Multiple Auto Scaling groups
- Auto-Discovery : Auto-Discovery is the preferred method to configure Cluster Autoscaler. Click here for more information.
- Control-plane Node setup
Cluster Autoscaler는 Launch Configuration 또는 Launch Template에서 지정된 인스턴스 유형을 기반으로 Auto Scaling Group이 제공하는 CPU, 메모리, GPU 리소스를 결정하려고 시도합니다.
# 현재 autoscaling(ASG) 정보 확인
# aws autoscaling describe-auto-scaling-groups --query "AutoScalingGroups[? Tags[? (Key=='eks:cluster-name') && Value=='클러스터이름']].[AutoScalingGroupName, MinSize, MaxSize,DesiredCapacity]" --output table
aws autoscaling describe-auto-scaling-groups \
    --query "AutoScalingGroups[? Tags[? (Key=='eks:cluster-name') && Value=='myeks']].[AutoScalingGroupName, MinSize, MaxSize,DesiredCapacity]" \
    --output table
-----------------------------------------------------------------
|                   DescribeAutoScalingGroups                   |
+------------------------------------------------+----+----+----+
|  eks-ng1-44c41109-daa3-134c-df0e-0f28c823cb47  |  3 |  3 |  3 |
+------------------------------------------------+----+----+----+

# MaxSize 6개로 수정
export ASG_NAME=$(aws autoscaling describe-auto-scaling-groups --query "AutoScalingGroups[? Tags[? (Key=='eks:cluster-name') && Value=='myeks']].AutoScalingGroupName" --output text)
aws autoscaling update-auto-scaling-group --auto-scaling-group-name ${ASG_NAME} --min-size 3 --desired-capacity 3 --max-size 6

# 확인
aws autoscaling describe-auto-scaling-groups --query "AutoScalingGroups[? Tags[? (Key=='eks:cluster-name') && Value=='myeks']].[AutoScalingGroupName, MinSize, MaxSize,DesiredCapacity]" --output table
-----------------------------------------------------------------
|                   DescribeAutoScalingGroups                   |
+------------------------------------------------+----+----+----+
|  eks-ng1-c2c41e26-6213-a429-9a58-02374389d5c3  |  3 |  6 |  3 |
+------------------------------------------------+----+----+----+

# 배포 : Deploy the Cluster Autoscaler (CAS)
curl -s -O https://raw.githubusercontent.com/kubernetes/autoscaler/master/cluster-autoscaler/cloudprovider/aws/examples/cluster-autoscaler-autodiscover.yaml
...
            - ./cluster-autoscaler
            - --v=4
            - --stderrthreshold=info
            - --cloud-provider=aws
            - --skip-nodes-with-local-storage=false # 로컬 스토리지를 가진 노드를 autoscaler가 scale down할지 결정, false(가능!)
            - --expander=least-waste # 노드를 확장할 때 어떤 노드 그룹을 선택할지를 결정, least-waste는 리소스 낭비를 최소화하는 방식으로 새로운 노드를 선택.
            - --node-group-auto-discovery=asg:tag=k8s.io/cluster-autoscaler/enabled,k8s.io/cluster-autoscaler/<YOUR CLUSTER NAME>
...

sed -i -e "s|<YOUR CLUSTER NAME>|$CLUSTER_NAME|g" cluster-autoscaler-autodiscover.yaml
kubectl apply -f cluster-autoscaler-autodiscover.yaml

# 확인
kubectl get pod -n kube-system | grep cluster-autoscaler
kubectl describe deployments.apps -n kube-system cluster-autoscaler
kubectl describe deployments.apps -n kube-system cluster-autoscaler | grep node-group-auto-discovery
      --node-group-auto-discovery=asg:tag=k8s.io/cluster-autoscaler/enabled,k8s.io/cluster-autoscaler/myeks

# (옵션) cluster-autoscaler 파드가 동작하는 워커 노드가 퇴출(evict) 되지 않게 설정
kubectl -n kube-system annotate deployment.apps/cluster-autoscaler cluster-autoscaler.kubernetes.io/safe-to-evict="false"
☞ SCALE A CLUSTER WITH Cluster Autoscaler(CA) - Link
# 모니터링
kubectl get nodes -w
while true; do kubectl get node; echo "------------------------------" ; date ; sleep 1; done
while true; do aws ec2 describe-instances --query "Reservations[*].Instances[*].{PrivateIPAdd:PrivateIpAddress,InstanceName:Tags[?Key=='Name']|[0].Value,Status:State.Name}" --filters Name=instance-state-name,Values=running --output text ; echo "------------------------------"; date; sleep 1; done

# Deploy a Sample App
# We will deploy an sample nginx application as a ReplicaSet of 1 Pod
cat << EOF > nginx.yaml
apiVersion: apps/v1
kind: Deployment
metadata:
  name: nginx-to-scaleout
spec:
  replicas: 1
  selector:
    matchLabels:
      app: nginx
  template:
    metadata:
      labels:
        service: nginx
        app: nginx
    spec:
      containers:
      - image: nginx
        name: nginx-to-scaleout
        resources:
          limits:
            cpu: 500m
            memory: 512Mi
          requests:
            cpu: 500m
            memory: 512Mi
EOF
kubectl apply -f nginx.yaml
kubectl get deployment/nginx-to-scaleout

# Scale our ReplicaSet
# Let’s scale out the replicaset to 15
kubectl scale --replicas=15 deployment/nginx-to-scaleout && date

# 확인
kubectl get pods -l app=nginx -o wide --watch
kubectl -n kube-system logs -f deployment/cluster-autoscaler

# 노드 자동 증가 확인
kubectl get nodes
aws autoscaling describe-auto-scaling-groups \
    --query "AutoScalingGroups[? Tags[? (Key=='eks:cluster-name') && Value=='myeks']].[AutoScalingGroupName, MinSize, MaxSize,DesiredCapacity]" \
    --output table

eks-node-viewer --resources cpu,memory
혹은
eks-node-viewer

# [운영서버 EC2] 최근 1시간 Fleet API 호출 확인 - Link
# https://ap-northeast-2.console.aws.amazon.com/cloudtrailv2/home?region=ap-northeast-2#/events?EventName=CreateFleet
aws cloudtrail lookup-events \
  --lookup-attributes AttributeKey=EventName,AttributeValue=CreateFleet \
  --start-time "$(date -d '1 hour ago' --utc +%Y-%m-%dT%H:%M:%SZ)" \
  --end-time "$(date --utc +%Y-%m-%dT%H:%M:%SZ)"

# (참고) Event name : UpdateAutoScalingGroup
# https://ap-northeast-2.console.aws.amazon.com/cloudtrailv2/home?region=ap-northeast-2#/events?EventName=UpdateAutoScalingGroup


# 디플로이먼트 삭제
kubectl delete -f nginx.yaml && date

# [scale-down] 노드 갯수 축소 : 기본은 10분 후 scale down 됨, 물론 아래 flag 로 시간 수정 가능 >> 그러니 디플로이먼트 삭제 후 10분 기다리고 나서 보자!
# By default, cluster autoscaler will wait 10 minutes between scale down operations,
# you can adjust this using the --scale-down-delay-after-add, --scale-down-delay-after-delete,
# and --scale-down-delay-after-failure flag.
# E.g. --scale-down-delay-after-add=5m to decrease the scale down delay to 5 minutes after a node has been added.

# 터미널1
watch -d kubectl get node


- CloudTrail 에 CreateFleet 이벤트 확인 - Link
# CloudTrail 에 CreateFleet 이벤트 조회 : 최근 90일 가능
aws cloudtrail lookup-events --lookup-attributes AttributeKey=EventName,AttributeValue=CreateFleet
☞ 리소스 삭제
# 위 실습 중 디플로이먼트 삭제 후 10분 후 노드 갯수 축소되는 것을 확인 후 아래 삭제를 해보자! >> 만약 바로 아래 CA 삭제 시 워커 노드는 4개 상태가 되어서 수동으로 2대 변경 하자!
kubectl delete -f nginx.yaml

# size 수정
aws autoscaling update-auto-scaling-group --auto-scaling-group-name ${ASG_NAME} --min-size 3 --desired-capacity 3 --max-size 3
aws autoscaling describe-auto-scaling-groups --query "AutoScalingGroups[? Tags[? (Key=='eks:cluster-name') && Value=='myeks']].[AutoScalingGroupName, MinSize, MaxSize,DesiredCapacity]" --output table

# Cluster Autoscaler 삭제
kubectl delete -f cluster-autoscaler-autodiscover.yaml

☞ CAS 문제점 : 하나의 자원에 대해 두군데 (AWS ASG vs AWS EKS)에서 각자의 방식으로 관리 ⇒ 관리 정보가 서로 동기화되지 않아 다양한 문제 발생
- CA 문제점 : ASG에만 의존하고 노드 생성/삭제 등에 직접 관여 안함
- EKS에서 노드를 삭제 해도 인스턴스는 삭제 안됨
- 노드 축소 될 때 특정 노드가 축소 되도록 하기 매우 어려움 : pod이 적은 노드 먼저 축소, 이미 드레인 된 노드 먼저 축소
- 특정 노드를 삭제 하면서 동시에 노드 개수를 줄이기 어려움 : 줄일때 삭제 정책 옵션이 다양하지 않음
- 정책 미지원 시 삭제 방식(예시) : 100대 중 미삭제 EC2 보호 설정 후 삭제 될 ec2의 파드를 이주 후 scaling 조절로 삭제 후 원복
- 특정 노드를 삭제하면서 동시에 노드 개수를 줄이기 어려움
- 폴링 방식이기에 너무 자주 확장 여유를 확인 하면 API 제한에 도달할 수 있음
- 스케일링 속도가 느림
- Cluster Autoscaler 는 쿠버네티스 클러스터 자체의 오토 스케일링을 의미하며, 수요에 따라 워커 노드를 자동으로 추가하는 기능
- 언뜻 보기에 클러스터 전체나 각 노드의 부하 평균이 높아졌을 때 확장으로 보인다 → 함정! 🚧
- Pending 상태의 파드가 생기는 타이밍에 처음으로 Cluster Autoscaler 이 동작한다
- 즉, Request 와 Limits 를 적절하게 설정하지 않은 상태에서는 실제 노드의 부하 평균이 낮은 상황에서도 스케일 아웃이 되거나, 부하 평균이 높은 상황임에도 스케일 아웃이 되지 않는다!
- 기본적으로 리소스에 의한 스케줄링은 Requests(최소)를 기준으로 이루어진다. 다시 말해 Requests 를 초과하여 할당한 경우에는 최소 리소스 요청만으로 리소스가 꽉 차 버려서 신규 노드를 추가해야만 한다. 이때 실제 컨테이너 프로세스가 사용하는 리소스 사용량은 고려되지 않는다.
- 반대로 Request 를 낮게 설정한 상태에서 Limit 차이가 나는 상황을 생각해보자. 각 컨테이너는 Limits 로 할당된 리소스를 최대로 사용한다. 그래서 실제 리소스 사용량이 높아졌더라도 Requests 합계로 보면 아직 스케줄링이 가능하기 때문에 클러스터가 스케일 아웃하지 않는 상황이 발생한다.
- 여기서는 CPU 리소스 할당을 예로 설명했지만 메모리의 경우도 마찬가지다.
5. CPA - Cluster Proportional Autoscaler
☞ 소개 : 노드 수 증가에 비례하여 성능 처리가 필요한 애플리케이션(컨테이너/파드)를 수평으로 자동 확장 ex. coredns - Github Workshop

#
helm repo add cluster-proportional-autoscaler https://kubernetes-sigs.github.io/cluster-proportional-autoscaler

# CPA규칙을 설정하고 helm차트를 릴리즈 필요
helm upgrade --install cluster-proportional-autoscaler cluster-proportional-autoscaler/cluster-proportional-autoscaler

# nginx 디플로이먼트 배포
cat <<EOT > cpa-nginx.yaml
apiVersion: apps/v1
kind: Deployment
metadata:
  name: nginx-deployment
spec:
  replicas: 1
  selector:
    matchLabels:
      app: nginx
  template:
    metadata:
      labels:
        app: nginx
    spec:
      containers:
      - name: nginx
        image: nginx:latest
        resources:
          limits:
            cpu: "100m"
            memory: "64Mi"
          requests:
            cpu: "100m"
            memory: "64Mi"
        ports:
        - containerPort: 80
EOT
kubectl apply -f cpa-nginx.yaml

# CPA 규칙 설정
cat <<EOF > cpa-values.yaml
config:
  ladder:
    nodesToReplicas:
      - [1, 1]
      - [2, 2]
      - [3, 3]
      - [4, 3]
      - [5, 5]
options:
  namespace: default
  target: "deployment/nginx-deployment"
EOF
kubectl describe cm cluster-proportional-autoscaler

# 모니터링
watch -d kubectl get pod

# helm 업그레이드
helm upgrade --install cluster-proportional-autoscaler -f cpa-values.yaml cluster-proportional-autoscaler/cluster-proportional-autoscaler

# 노드 5개로 증가
export ASG_NAME=$(aws autoscaling describe-auto-scaling-groups --query "AutoScalingGroups[? Tags[? (Key=='eks:cluster-name') && Value=='myeks']].AutoScalingGroupName" --output text)
aws autoscaling update-auto-scaling-group --auto-scaling-group-name ${ASG_NAME} --min-size 5 --desired-capacity 5 --max-size 5
aws autoscaling describe-auto-scaling-groups --query "AutoScalingGroups[? Tags[? (Key=='eks:cluster-name') && Value=='myeks']].[AutoScalingGroupName, MinSize, MaxSize,DesiredCapacity]" --output table

# 노드 4개로 축소
aws autoscaling update-auto-scaling-group --auto-scaling-group-name ${ASG_NAME} --min-size 4 --desired-capacity 4 --max-size 4
aws autoscaling describe-auto-scaling-groups --query "AutoScalingGroups[? Tags[? (Key=='eks:cluster-name') && Value=='myeks']].[AutoScalingGroupName, MinSize, MaxSize,DesiredCapacity]" --output table


- 삭제: helm uninstall cluster-proportional-autoscaler && kubectl delete -f cpa-nginx.yaml
- (참고) CPU/Memory 기반 정책 - Blog
 "coresToReplicas":
      [
        [ 1, 1 ],
        [ 64, 3 ],
        [ 512, 5 ],
        [ 1024, 7 ],
        [ 2048, 10 ],
        [ 4096, 15 ]
      ],
- 운영서버 EC2]에서 원클릭 삭제 진행 : Karpenter 실습 환경 준비를 위해서 현재 EKS 실습 환경 전부 삭제
# eksctl delete cluster --name $CLUSTER_NAME && aws cloudformation delete-stack --stack-name $CLUSTER_NAME
nohup sh -c "eksctl delete cluster --name $CLUSTER_NAME && aws cloudformation delete-stack --stack-name $CLUSTER_NAME" > /root/delete.log 2>&1 &

# (옵션) 삭제 과정 확인
tail -f delete.log